

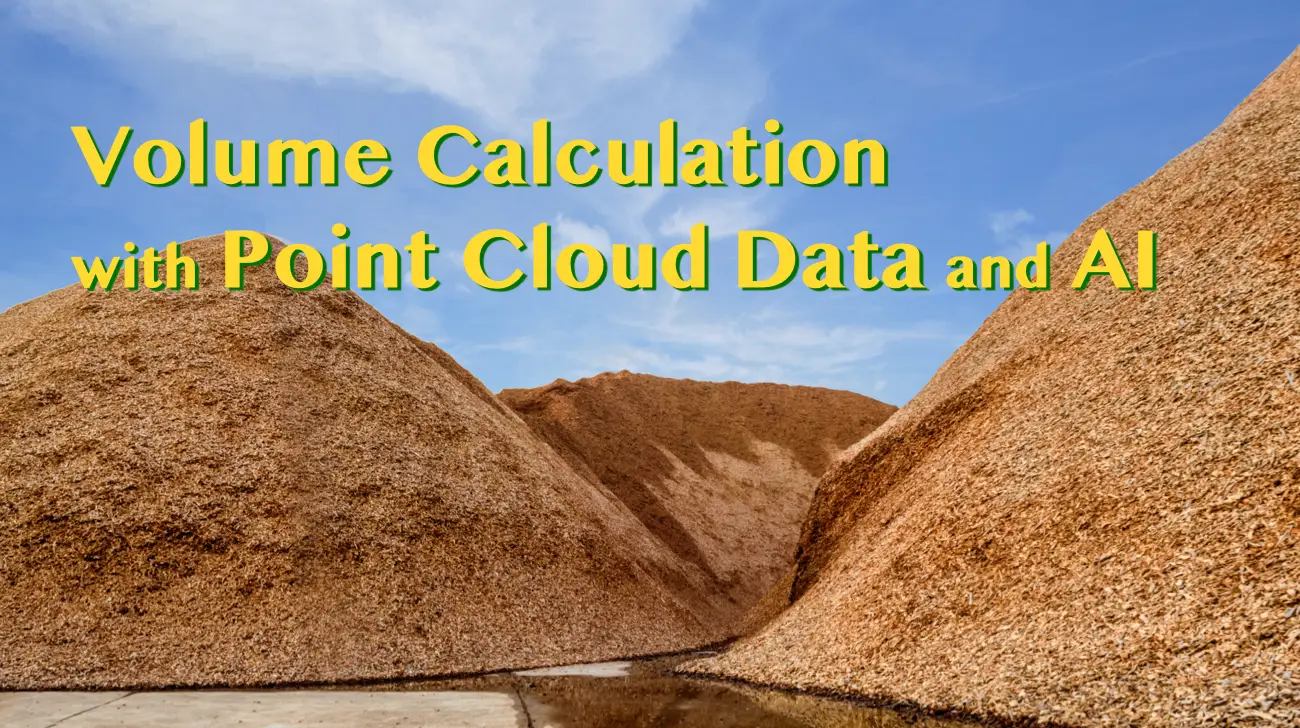
Wood Powder Volume Calculation using Point Cloud Data and AI
My name is Md Shafiqul Islam and I belong to Chowagiken's AI image group. Chowagiken receives a variety of consultations, including consultations unique to Hokkaido. This time, I wrote an article based on my research on whether it was possible to measure the volume of agriculture-related products using point cloud data and AI. I hope this will be helpful to those who have similar problems.
Point clouds are used across a variety of fields and applications, each leveraging the unique capabilities of point cloud data to represent and analyze complex three-dimensional shapes and spaces. Estimating volume from point cloud data is a crucial task in various fields, such as civil engineering, mining, agriculture, and environmental science. The process involves creating a 3D model from the point cloud and then calculating the volume of the object or space represented by that model. Here the detail procedure is described step by step for wood powder volume calculation from 3D point cloud data.
目次
Background & Objectives
Measuring the volume of a pile of sediment, crops, materials, etc. is a labor-intensive task. It will be very helpful if AI can be used to provide easy-to-implement services to companies suffering from labor shortages. We worked on the development of such AI using wood powder as an example.
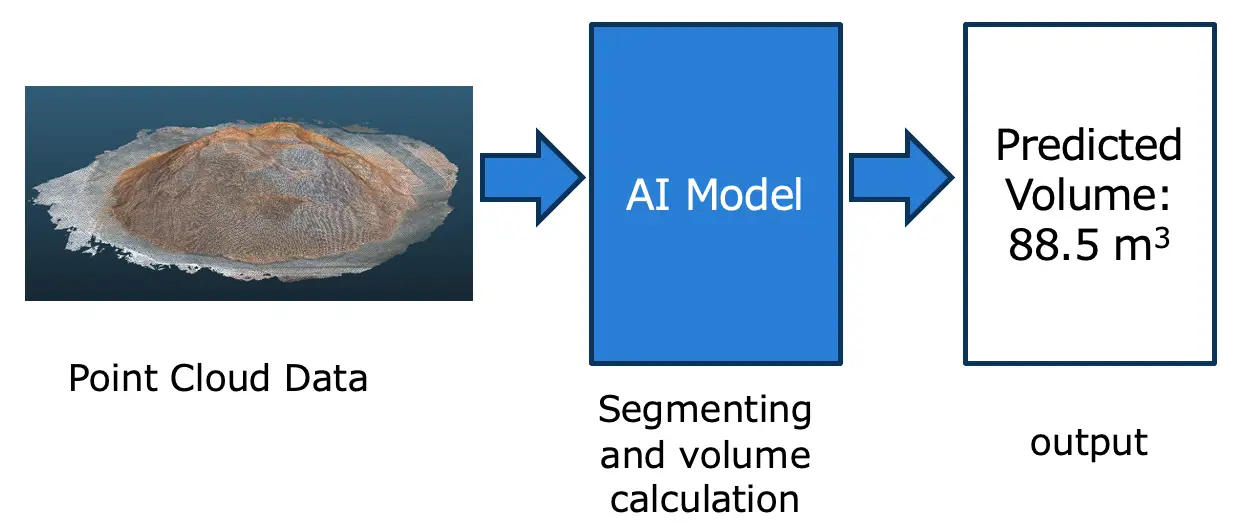 Fig 1: volume calculation
Fig 1 represents the overview of volume calculation. The AI model takes input wood powder data (point cloud data) and provides volume as output.
Point Cloud
Point clouds represent a basic type of 3D model, consisting of numerous discrete points arranged in three-dimensional space. Each point in the cloud is defined by its coordinates on the X, Y, and Z axes. Often, these points also carry extra information such as color, recorded in RGB format, and luminance values, which indicate the brightness of each point.
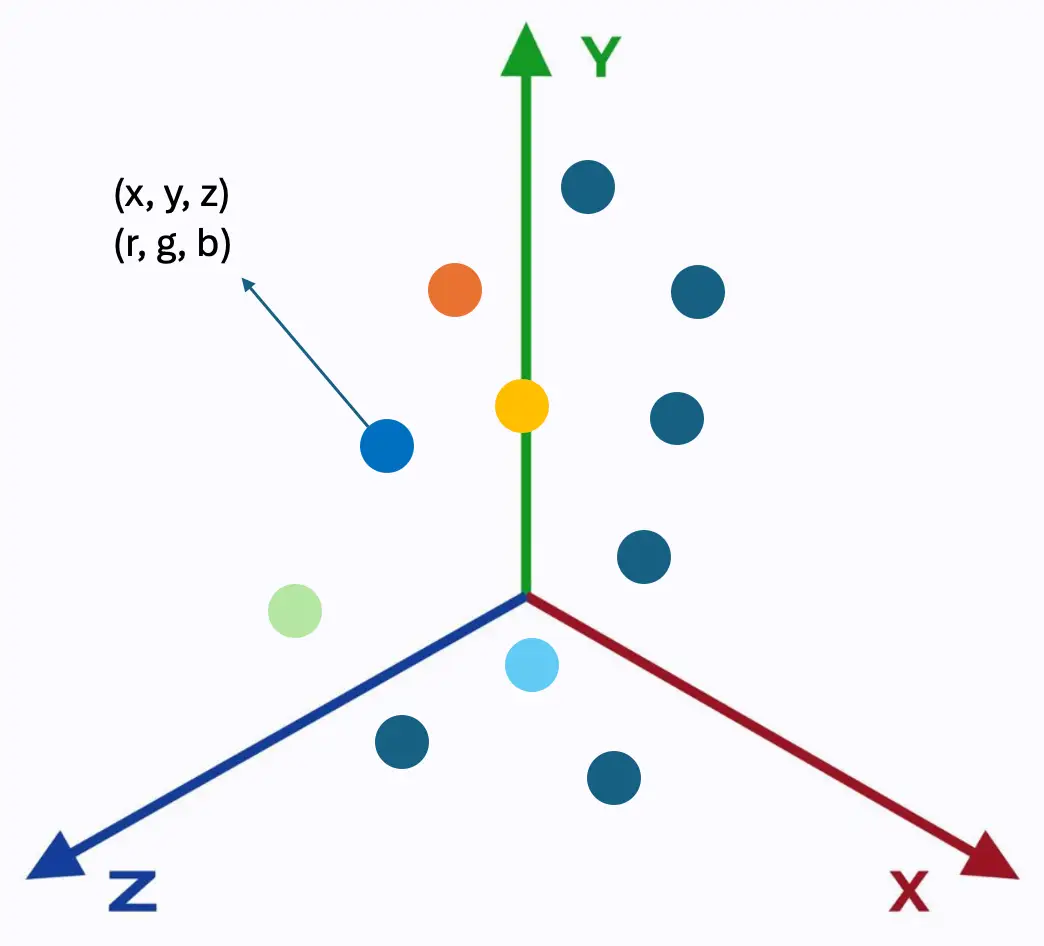 Fig 2: point cloudIn Fig 2 the points are represented in 3D coordinate systems. The points hold x, y, z coordinates and color values. The most common file format to store point cloud data is a ‘.las’ file format. This binary file format maintains information specific to LiDAR without the loss of information.
Point clouds are created by performing a scan of an object or structure. Scans are completed by using either a laser scanner or through a process called photogrammetry.
Laser Scanners
Laser scanners, particularly those using the Light Detection and Ranging (LiDAR) technique, function by emitting numerous light pulses (over 160,000 per second) onto an object's surface and measuring the time it takes for each pulse to bounce back. Each pulse helps determine the exact location of points on the object. With about 15 pulses per one-meter pixel, these points collectively form a point cloud. After collecting and processing these measurements, the resulting data is compiled into point cloud data, providing a precise digital representation of the object.
Photogrammetry
It is the process of creating measurements from pictures. It involves taking multiple overlapping photographs from different angles and then using software to analyze these images to detect common points and reconstruct the shape and position of the objects in three dimensions. The process can be divided into several stages: capturing the images, processing the images to create a photogrammetric model, and refining the model to enhance accuracy and detail.
Data Analysis
To train the AI model we need to prepare data. In this section, we will describe the data acquisition process, how to extract meaningful information from the file and how to visualize point cloud data.
Data Acquisition
The wood powder data is in fact 3D point cloud data. For each wood powder pile, the data is collected using iPhone 12 Pro device which has built-in Lidar technology. Scaniverse app is used to collect and save the data in .las format.
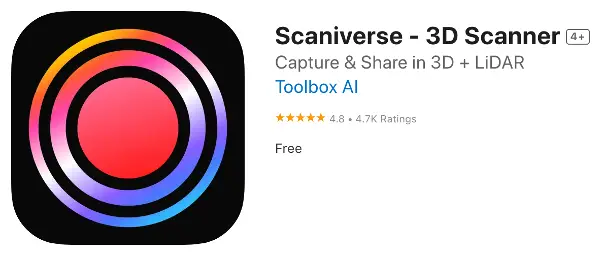 Fig 3: Scaniverse appFig 3 shows snippet of Scaniverse app which is used to collect and save the data in .las format. We can also use the app to crop target portion from data.
Data Extraction
The 3D point cloud data is saved in ‘.las’ (laser) format. The ‘laspy’ python lib is used to extract necessary data from las file. The data in las file has several properties like x, y, z coordinates of each point, RGB color value of each point, classification of each point etc. The classification value of each point is very important. During annotation we can assign class labels to the points and train the model to segment the points into groups.
Data Visualization
Each point cloud file contains lots of points (~ 300000). To visualize point clouds there are lots of tools available i.e.; CloudCompare, Pointly.
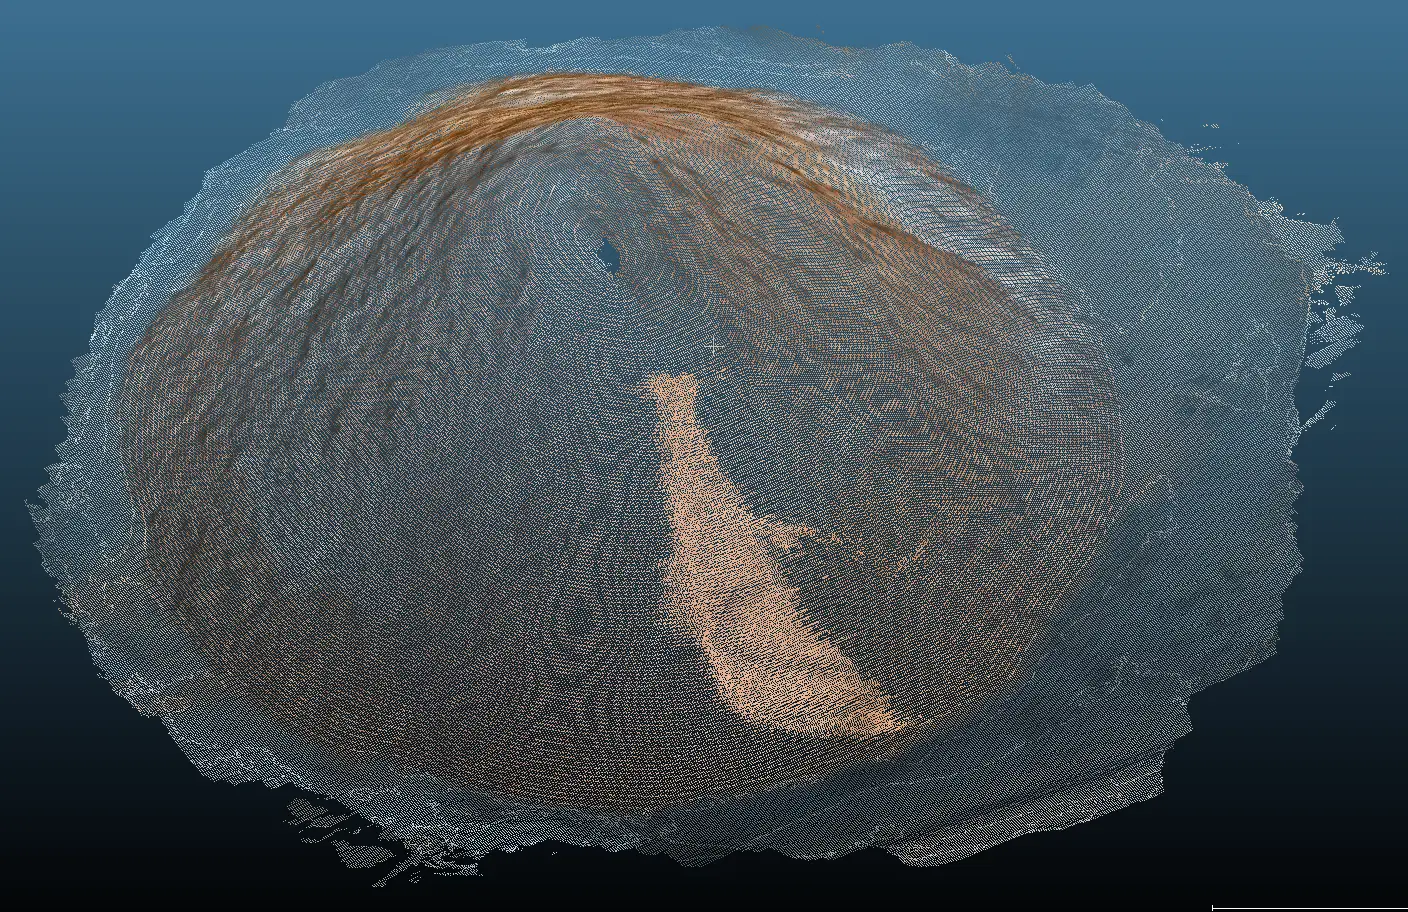 Fig 4: visualization of wood powder point cloud data
Fig 4 shows visualization of 3D point cloud data. As CloudCompare is quite popular and widely used for handling 3D point cloud data, here we have used it to visualize our wood powder data.
Annotation
For training any model annotation is quite important. To train our model we need to annotate 3D point cloud data. In our target data there are wood powder data, floor data and sometimes other object data (i.e wall, car). We have assigned label ‘0’ label for wood powder data (target) and ‘1’ for non- target data (floor, car, wall etc.)
Annotation Tools
There are many tools for annotating 3D point cloud data. For example, CloudCompare (free), Pointly, LabelCloud, VRMESH, CVAT etc. We have used CloudCompare tool for annotation as it is free for commercial usage and quite popular.
Annotation Process
To annotate point cloud data using CloudCompare tool requires several steps. Here is a step by step procedure to annotate wood powder data.
1. Import point cloud data in CloudCompare
2. Draw segment line around target region
3. Assign label for the target region (Fig 5)
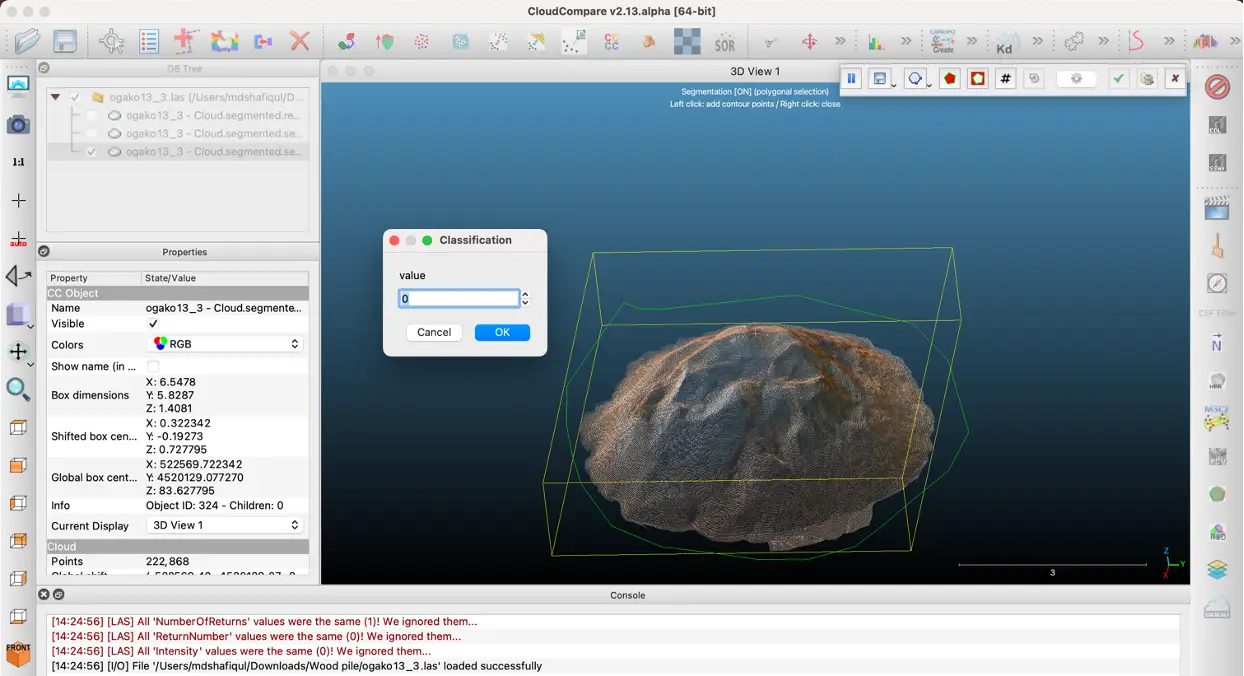 Fig 5: labeling cropped region
4. Crop the segmented region and save it
5. Select all the segmented regions (Fig 6)
6. Click “merge multiple clouds” button (marked with red circle). A single merged file will be created
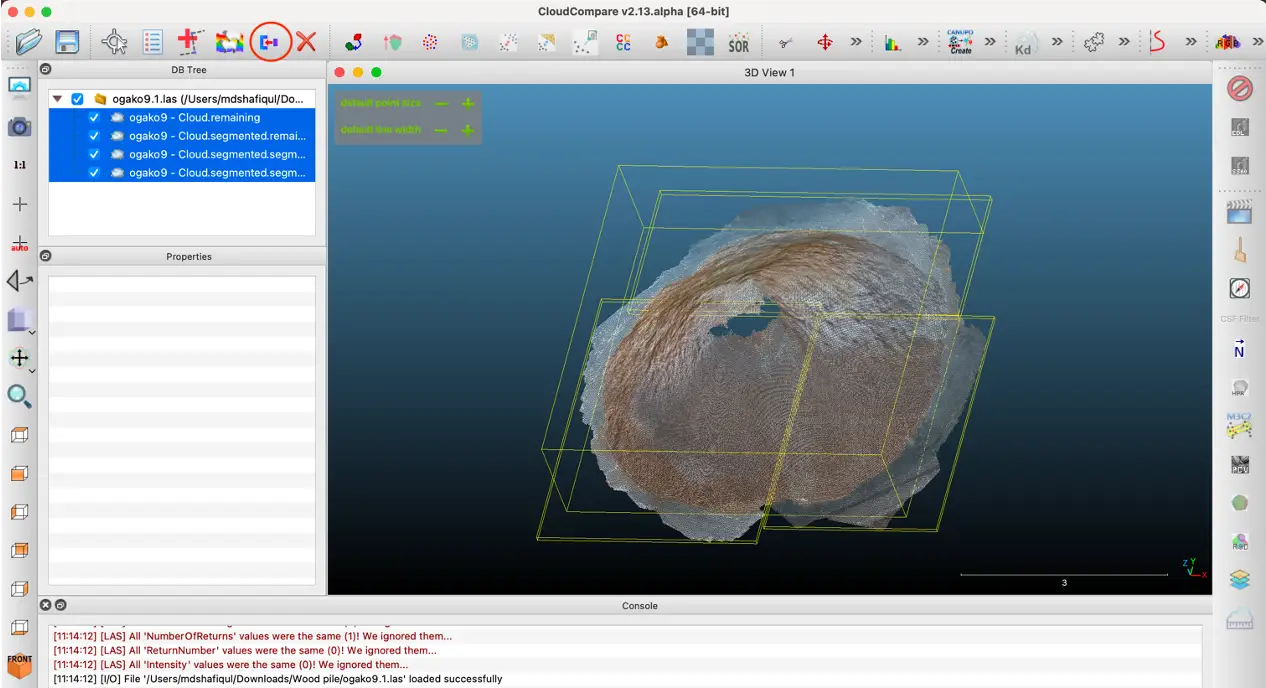 Fig 6: merge segmented regions
7. After merging all segmented regions, it will show each segment in different color based on ”Classification” value (Fig 7, 8)
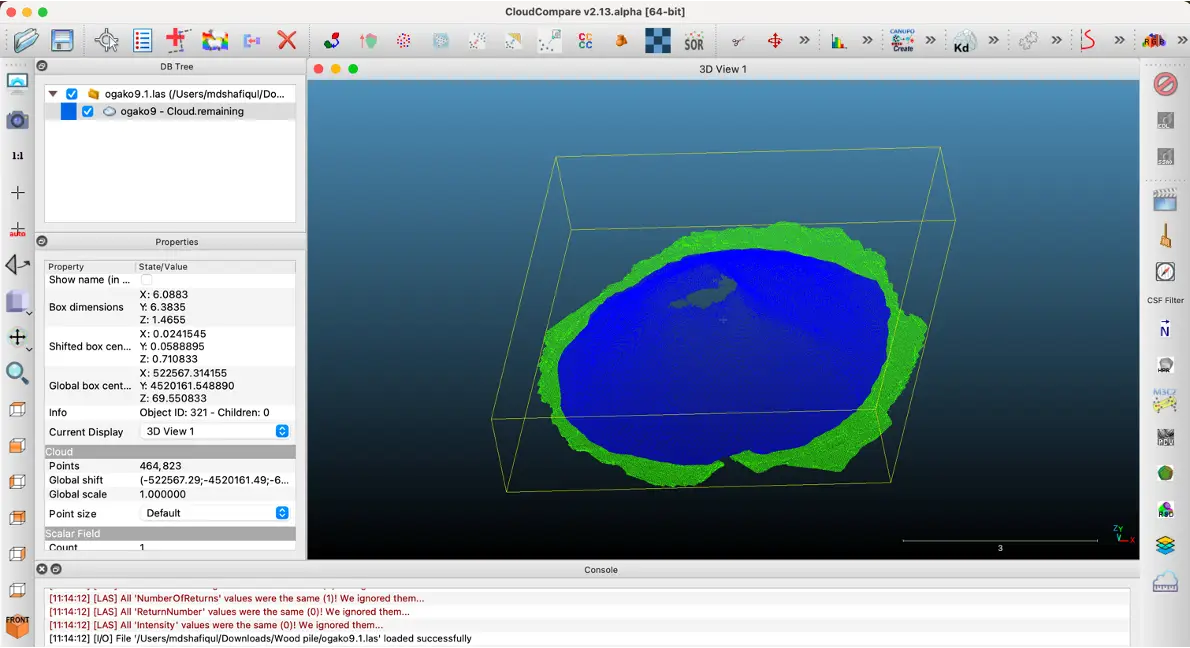 Fig 7: output of annotation
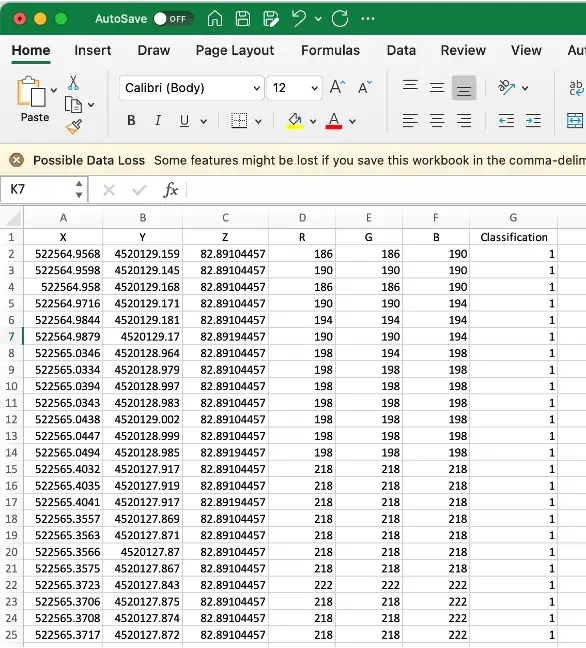 Fig 7: output of annotation
8. Save the annotated point cloud in any format (.las / .csv etc.)
PointNet Model
For calculating volume of wood powder, we need to do 3D semantic segmentation which means assigning a class label to every 3D point. There are many models that work on point cloud data. For example, PointNet, RangeNet, 2DPass etc. Some models require both point cloud data and input image whereas some models can work only on point cloud data.
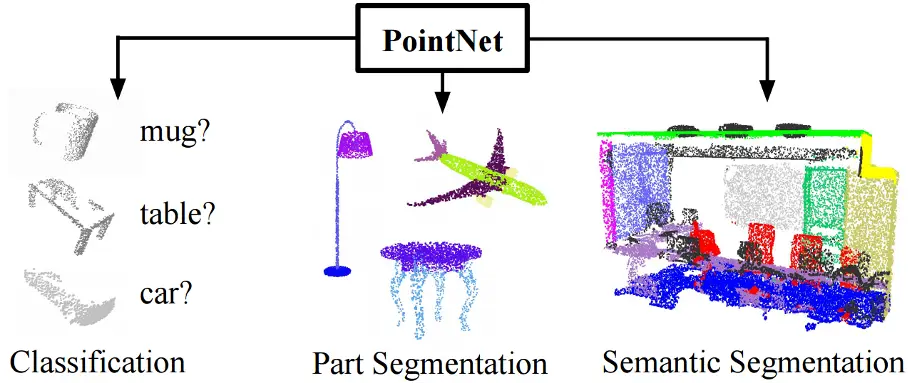 Fig 9: PointNet
PointNet is a novel architecture that can directly work on point cloud data. It does not need any external image of the input. Fig 9 shows the applicability of PointNet model in different areas (i.e classification segmentation). This blog will discuss an example of using the PointNet model for our wood powder volume measurement task.
PointNet is a point-based architecture, and it addresses challenges related to the representation and analysis of unstructured point cloud inputs. Here is a brief overview of PointNet model architecture.
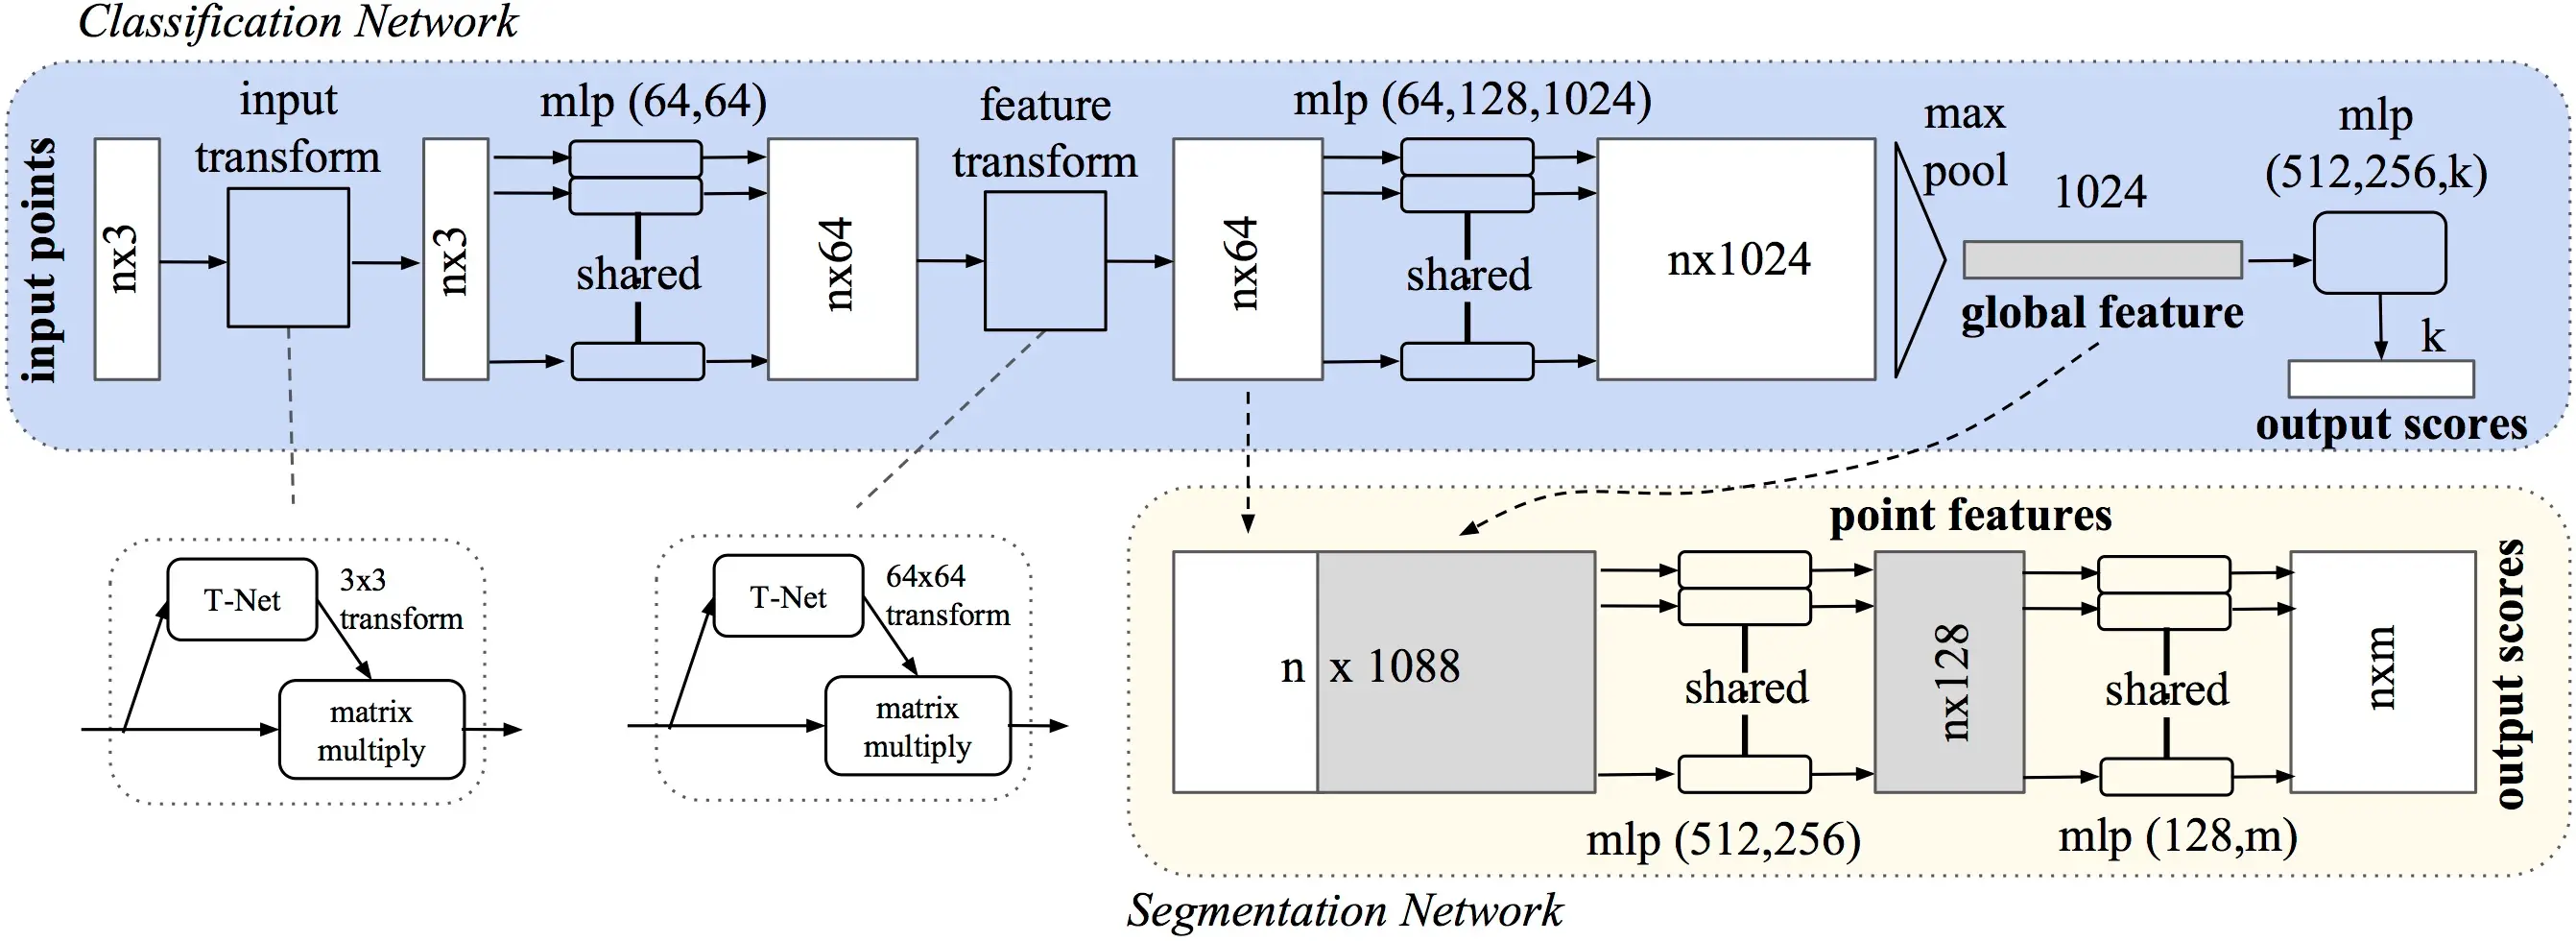 Fig 10: PointNet Architecture
Fig 10 represents overall architecture of PointNet model. The classification network processes a set of n points by performing input and feature transformations, and aggregates the point features using max pooling to generate classification scores for m classes. The segmentation network builds on this by merging both global and local features to assign scores to individual points. The architecture uses multi-layer perceptrons (MLP), with layer sizes indicated in parentheses. All layers are equipped with batch normalization and ReLU activation functions. For the classification network, dropout layers are included in the final MLP to promote model robustness by preventing overfitting.
PointNet can effectively learn to recognize point clouds in any orientation, eliminating the need for training with multiple orientations. This capability is enabled by a submodule within PointNet known as T-Net, as illustrated in the figure above.
The Backbone of PointNet integrates with the T-nets and serves as the main component of the network, excluding the classification head. It outputs Global Features for classification tasks, or a combination of Local and Global Features for segmentation purposes. The number of Global Features used in the paper was 1024.
The segmentation head processes the concatenation of learned local and global features, offering a comprehensive representation of the input Point Cloud. The global features are replicated n times for concatenation with the local features. The architecture consists of a sequence of shared MLPs (Multi-Layer Perceptrons) that preserve the original n dimensions. The final layer maps each point to one of m potential classes. Further details about architecture can be found in original paper.
Volume Measurement Pipeline
To measure volume from point cloud data we have to follow several steps. These are data preprocess, segmentation, outlier removal, coordinate shifting, triangular mesh generation and calculating volume from mesh.
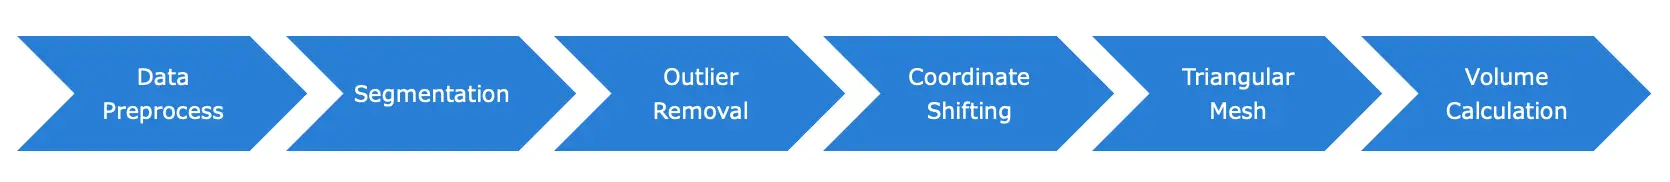 Fig 11: pipeline
Fig 11 shows all the steps in volume estimation pipeline. In data preprocess step we make multiple samples from each point cloud file using non overlapping sliding window technique. Then we train the AI model to segment point cloud data into multiple segments. It segments the data into 2 parts, target (wood powder points) and non-target (floor, wall points). After segmentation post processing is done by removing outliers. Then the point cloud’s X and Y coordinates are shifted so that the whole point cloud center coordinate becomes (0, 0) based. After coordinate shifting triangular mesh is generated from segmented point cloud data. Finally, we calculate volume of each triangular mesh and sum up together to get whole wood pile’s volume. Some of the steps in volume measurement pipeline are briefly described below.
Segmentation
To measure volume of wood powder we need to separate the target wood powder points from non-target points (i.e. floor, wall). To do the separation we need to do semantic segmentation. In this step, we will train the PointNet model on our data for doing semantic segmentation. The model will take point cloud sampling data as input and then segment them into target classes. It means to assign class label to each point.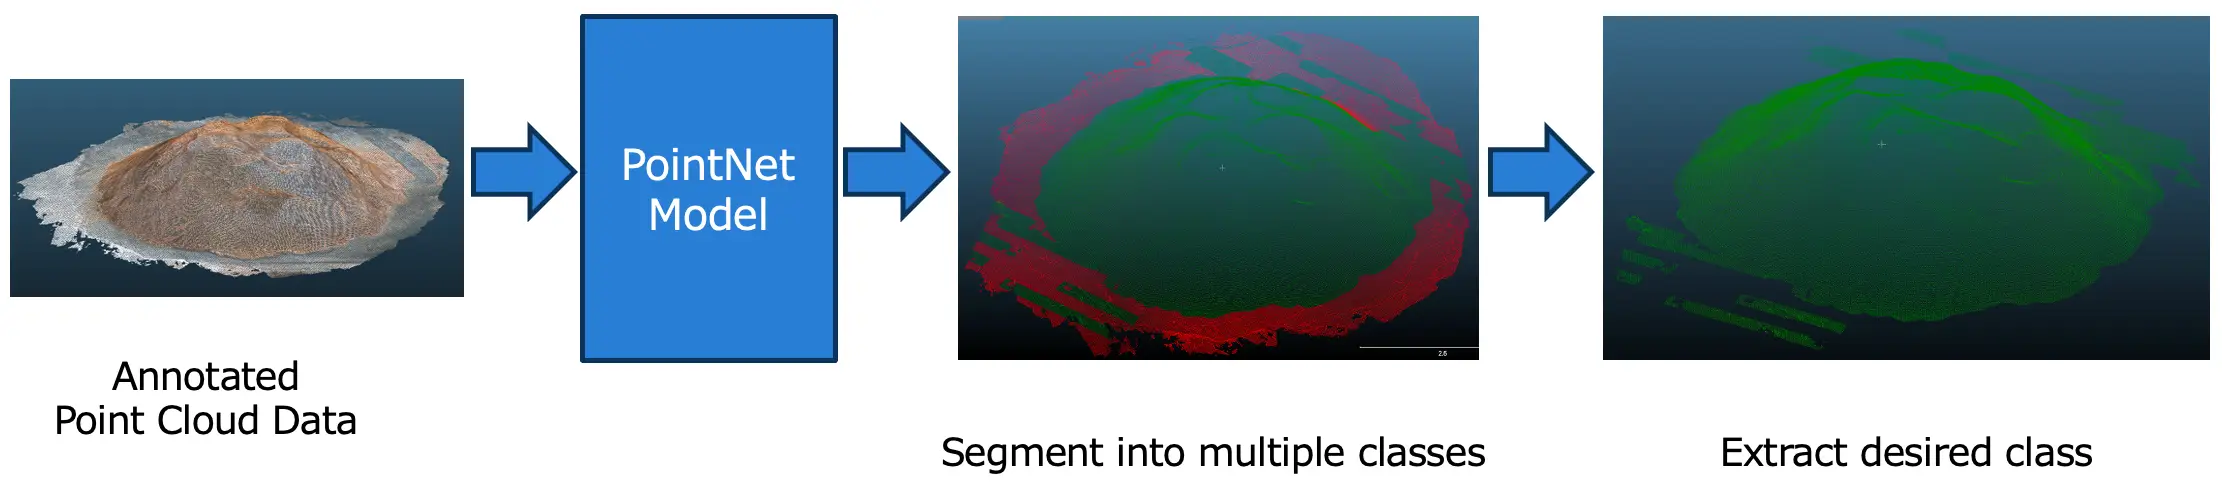 Fig 12: Segmentation
Fig 12 shows segmentation of target data non target data. The two colors in above figure represent target and non-target segments. Red color means non-target portion which contains points of floor, wall etc. On the other hand, green color means target segments which contains wood powder points. We used mIoU as a metric to measure segmentation performance of the AI model. On average the mIoU on test data is 86.95%.
Outlier Removal
After semantic segmentation and target class data extraction it is required to do some post processing. Here, we need to remove outlier.
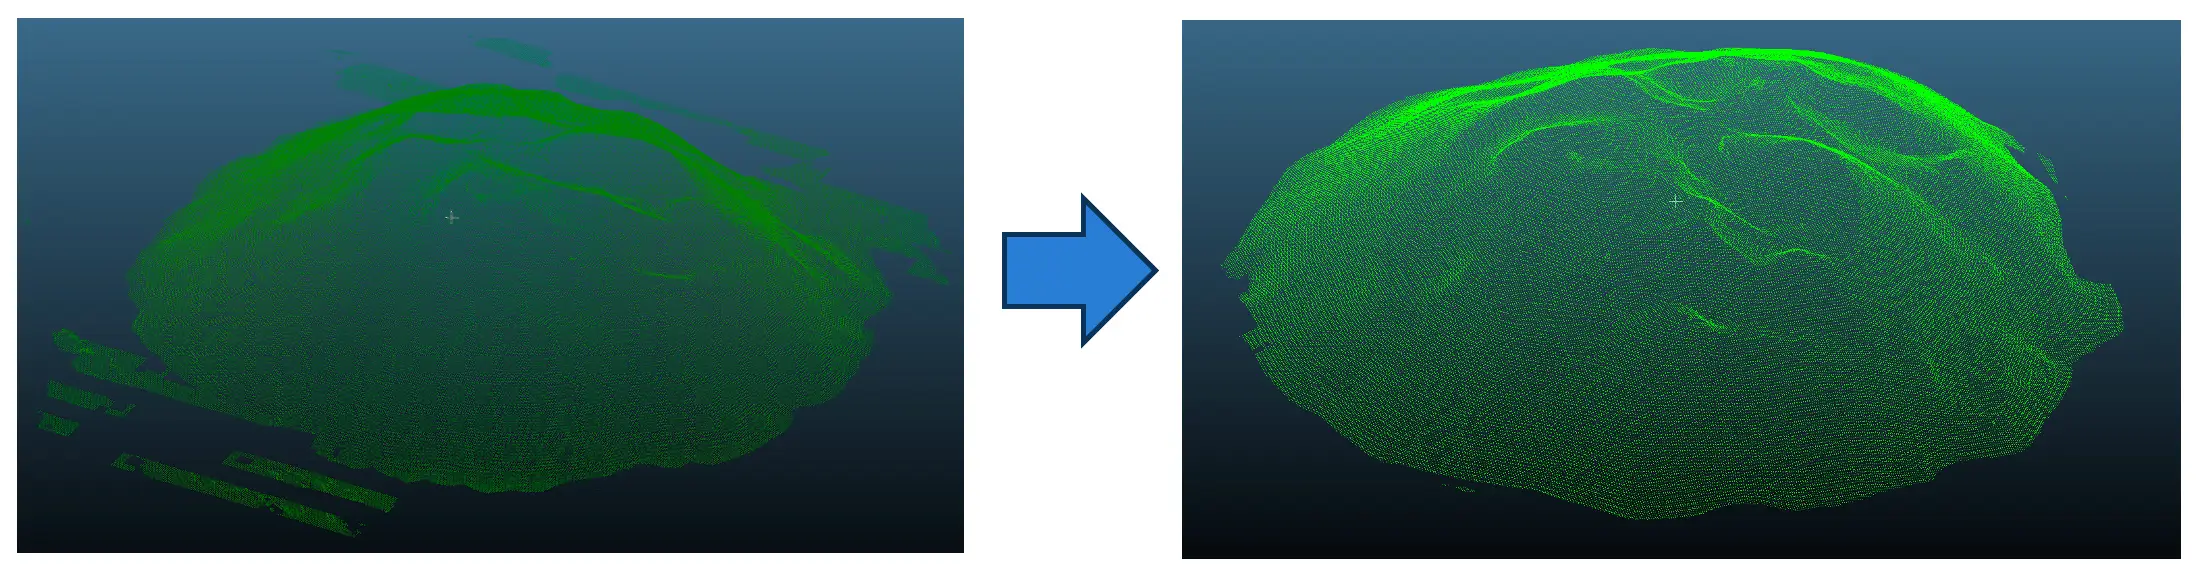 Fig 13: outlier removal
Fig 13 shows outlier removal of segmented target data. Removing outliers helps in calculating volume more precisely.
Triangular Mesh
It is not possible to compute the volume from a Point Cloud. So, a mesh is required. To create a mesh from point cloud data we can use surface reconstruction algorithms. Surface reconstruction is an ill-posed problem, meaning there is no perfect solution and algorithms are based on heuristics.
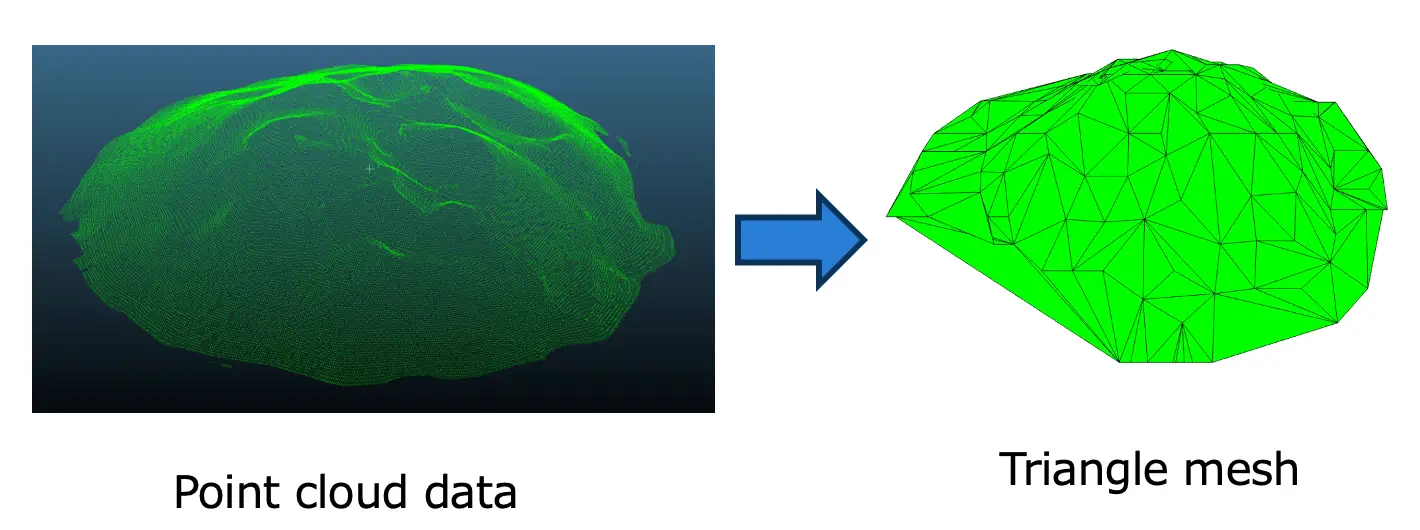 Fig 14: triangular mesh from point cloud
Fig 14 shows construction of mesh from point cloud data. A mesh is a set of interconnected triangles or polygons that describe the shape of an object. We have used Open3D lib to convert point clouds to triangular mesh.
Volume Calculation
From triangular mesh using Open3D we get surface. There are several ways to calculate volume from this surface. One of the approaches is to compute the volume of each triangle of the surface to the XY plane. Then just add the volumes of all the triangles to get total volume.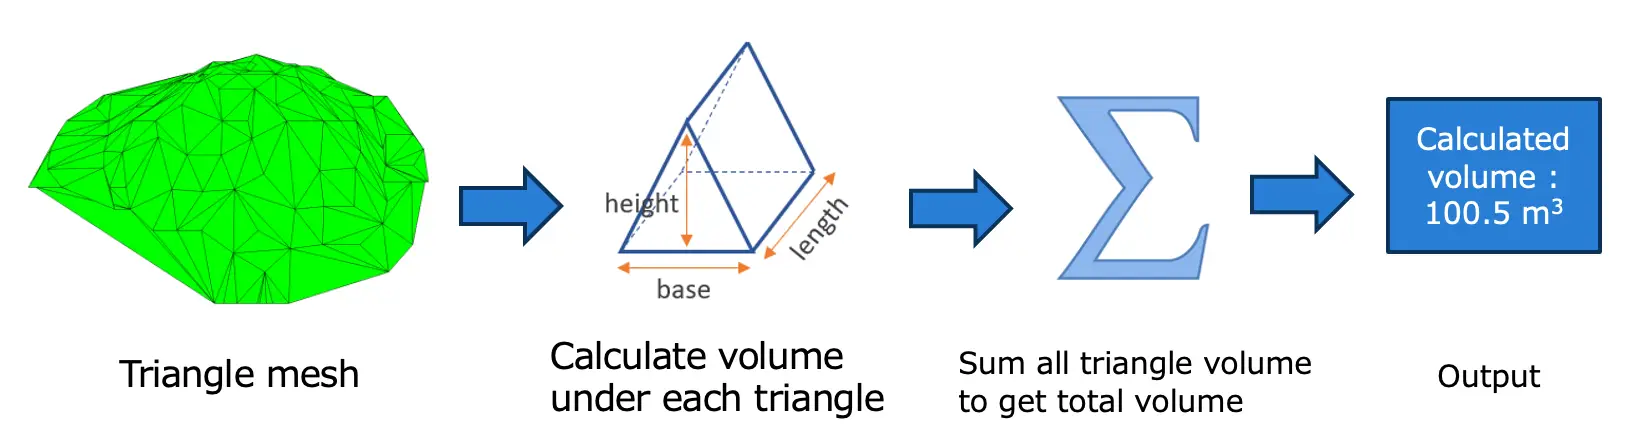 Fig 15: volume calculation
Fig 15 shows the flow of volume calculation from triangular mesh. We have followed the above approach and computed the volume from triangular mesh.
Result
In our experiment there were total 11 wood powder point cloud files. We used 6 files for training, 1 file for validation and 4 files for testing. Each file contains ~300,000 data points. We used GCP server to train and test the model.
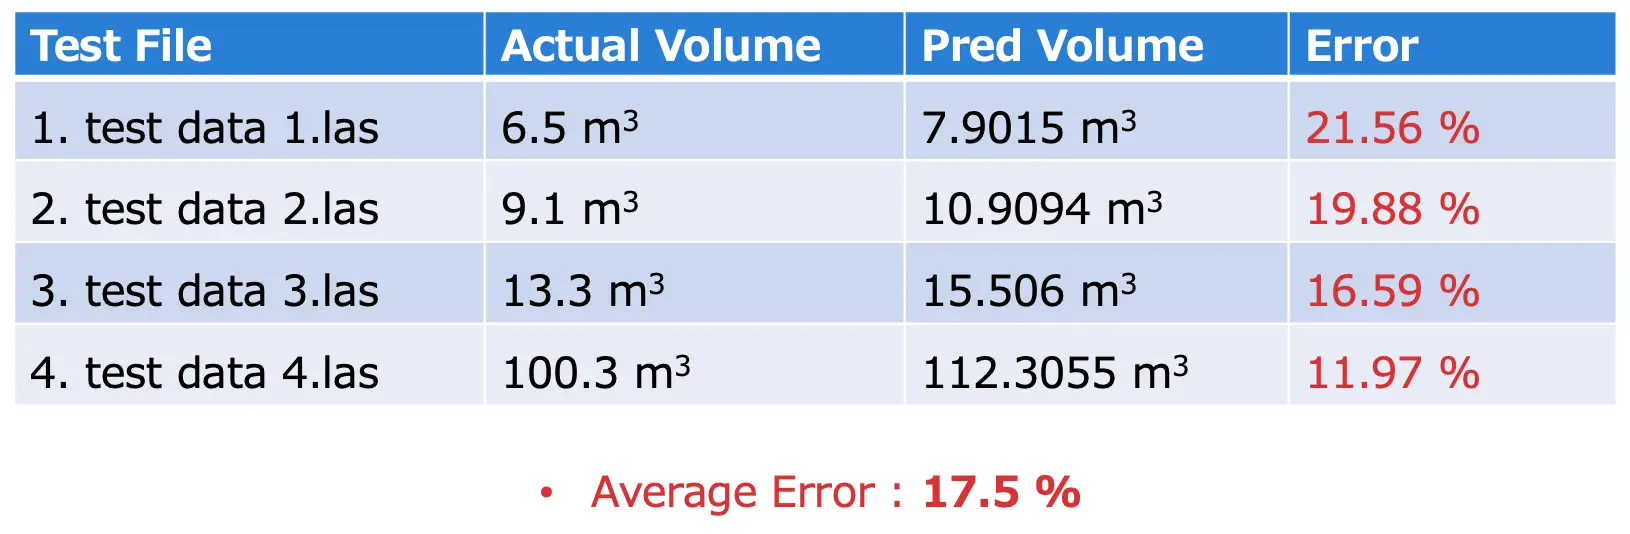 Table 1: test result
Table 1 shows result of our experiments. It shows actual and predicted volume with error. The average error is 17.5%. From the result table it is found that the pred volume is more than the actual volume. The reason is during segmentation due to lack of large data the mIoU was not more than 90%. So many outlier or false positive points exist. When we create triangular mesh, those outliers also exist. So more triangular mesh volume is calculated and when summed up together the overall volume of the wood pile increased. If there were more training data then the predicted volume would be much closer to actual volume.
Web App
We have developed a web app using Gradio framework for wood powder volume measurement. The web interface is split into 2 parts. The left side represents the input panel and right side represents output panel.
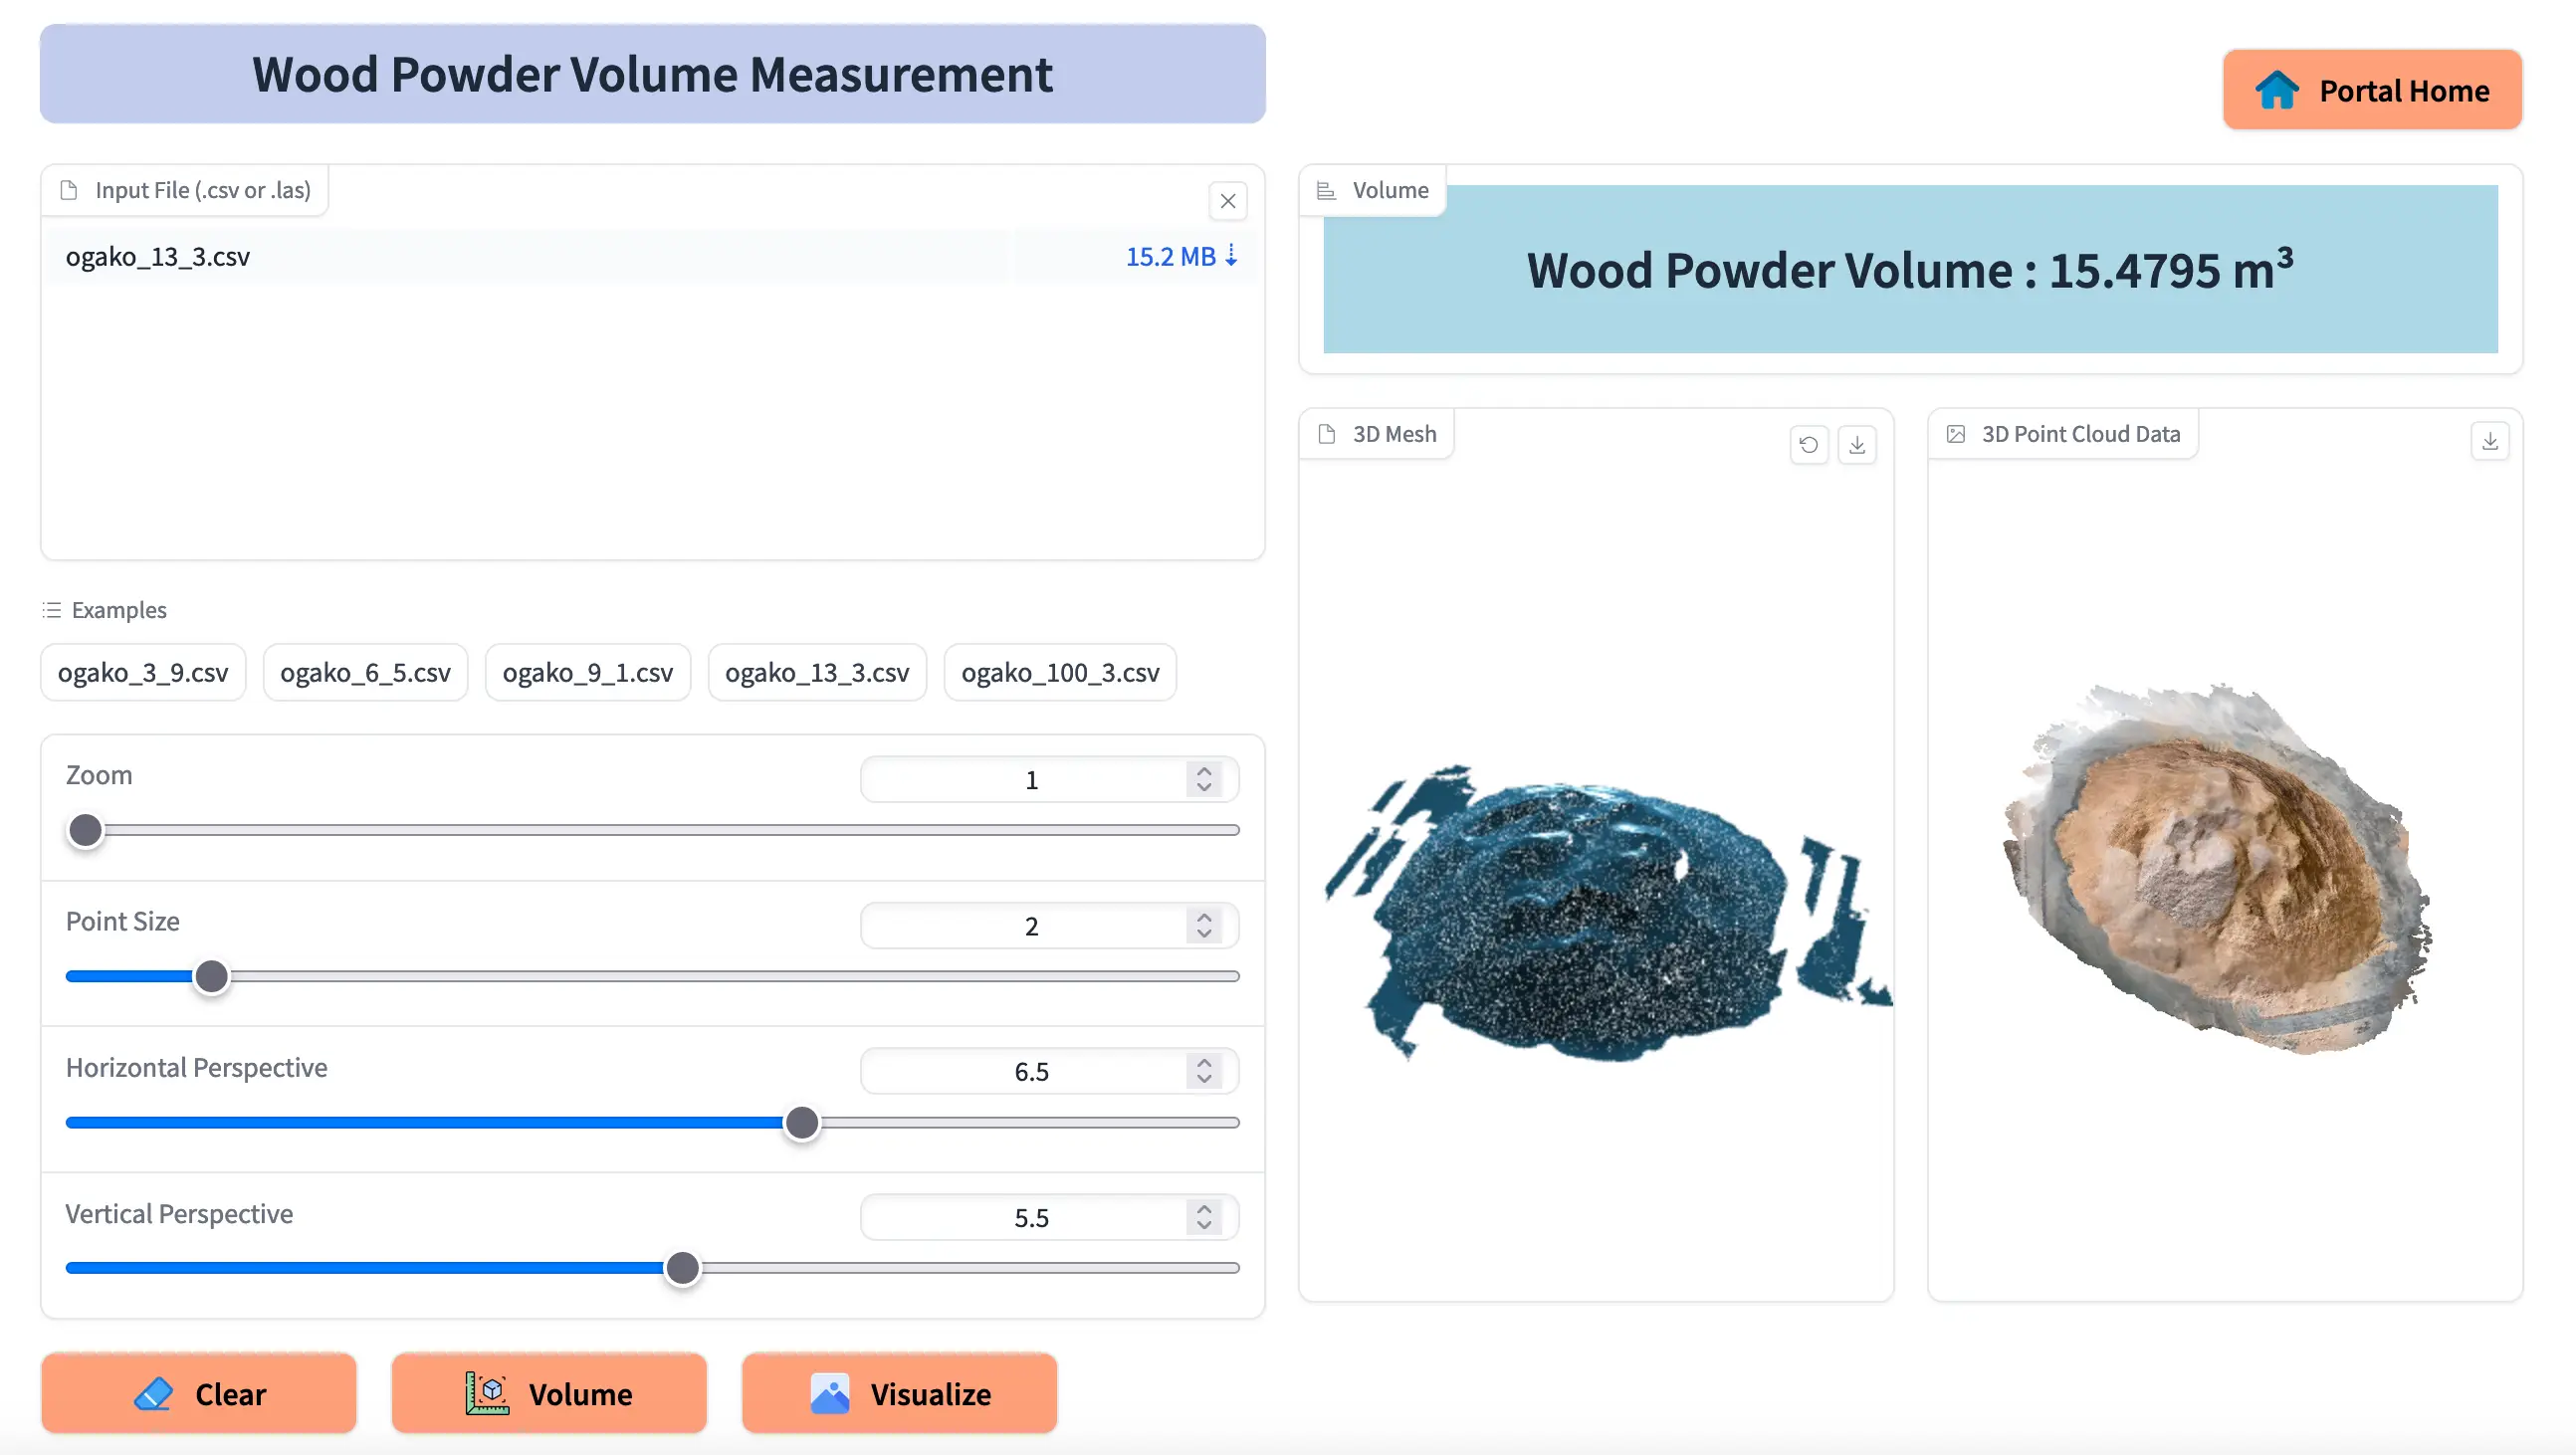 Fig 16: Web app
Fig 16 shows the UI of web app. In the input panel we can upload ‘las’ or ‘csv’ file to calculate volume. There are also some sliders in input panel through which we can change the visualization of input data. In the output panel the calculated volume for input data is shown. It also shows the visualization of input data into 2D image and 3D mesh format.
Summary
The main target was to measure volume of wood powder which comprises of point cloud data. We have used PointNet model for point cloud segmentation. After segmenting target data we have created triangular mesh and measured volume of each triangle. Then summed up all volumes of the 3D triangles to get overall volume of wood powder. The segmentation result and volume estimation result were quite good. The segmentation result (mIoU) is 86.95%. Average error of actual and predicted volume is 17.5%. There were not so much data for training and testing. More data will help to improve model performance and volume calculation accuracy.
In this way, Chowagiken continues to conduct research and development on a daily basis with the aim of implementing AI in society. If you have any problems, please feel free to contact us.
[References]
- Point Cloud : https://www.dronegenuity.com/point-clouds/
- Triangle volume : https://www.mathpages.com/home/kmath393/kmath393.htm
- Mesh Volume : https://jose-llorens-ripolles.medium.com/stockpile-volume-with-open3d-fa9d32099b6f
- Open3D : https://betterprogramming.pub/introduction-to-point-cloud-processing-dbda9b167534
- PointNet : https://towardsdatascience.com/point-net-for-semantic-segmentation-3eea48715a62
- CloudCompare : https://www.danielgm.net/cc/
- Laspy : https://laspy.readthedocs.io/en/latest/intro.html
- Gradio : https://www.gradio.app/
- Docker : https://www.docker.com/get-started/

記事を書いた人
Md Shafiqul Islam
Hello, my name is Md Shafiqul Islam, and currently I am working as an AI Engineer at Chowa Giken Co. I completed my Master's degree in 2020 from Kyushu Institute of Technology. I joined Chowa Giken in 2023. Here, I was engaged in several research projects focused on 3D point cloud data. I am particularly interested to computer vision and NLP to develop innovative solutions.
関連記事

AI Agent Vol.3【Agent の 学習と評価】

Google のLLM「Gemini 2.0 Flash Thinking」を試してみる

【GroqCloud】 爆速回答!?GroqCloudの実力とは

【まとめ】GPT-4.5 登場!史上最強のAIモデルがリサーチプレビューを公開

AI Agent Vol.2【Agent の 4つの要素】
Google のLLM「Gemini 2.0 Flash」を試してみる

2024年 年末のAI関連発表について

OpenAIが公開したLLMの事実性を評価する指標「SimpleQA」でモデルを測定してみた
AI導入に必須!PoC(概念実証)を成功させる進め方とポイント

The AI Scientist:AIによる論文の自動生成|さまざまな研究テーマを提案させてみる

AI Agent Vol. 1【Single AgentとMulti Agent】

AI活用成功に導く「AI導入アセスメント」とは――数理最適化AI事例をもとにポイントを解説

Llama 3 の日本語継続事前学習モデル「Llama-3-ELYZA-JP-8B」を試してみる

「戻れない変化」を生み出し続ける。コンサルを通して見極める業界DX実現への道筋

サステナビリティ領域で活躍するAI―SDGs×AI活用事例

MetaのオープンLLM「Llama3.2 3B-Instract」の精度を検証してみた|GPT4o-miniとの比較あり

OpenAIの軽量モデル「GPT-4o mini」を試してみる
Microsoft「GraphRAG」とLangchainの知識グラフを活用したRAGを比較
ChatGPTのAPI利用料金比較|最新モデルGPT-4o miniも検証

Langchain+Neo4j で「GraphRAG」を実装してみる
数理最適化ソルバー活用事例|組合せ最適化で社内交流会の班分けを自動化

GoogleのマルチモーダルLLM「Gemini.1.5 Flash」の精度を検証してみる

3次元点群データを用いた物体検出
GPT-4oを活用した画像検索システムの構築方法

Pythonコーディングを簡単に|LangChainで効率化【LLMことはじめ Vol.2】

Copilot for Microsoft 365で「PowerPoint」を使いこなす

Google のオープンLLM「Gemma」を試してみる|GPT-3.5 Turboとの比較あり
3次元点群データとAIを用いたオガ粉の体積計測

Llama 3 の日本語継続事前学習モデル「Llama 3 Youko 8B」を試してみる|他LLMとの比較あり
RAG(Retrieval Augmented Generation)を「Command R+」で試してみた|精度をGPT-4 Turboと比較

Dify(ディファイ)をGoogle Cloudにデプロイしてみた

“Azure OpenAI”で始めるPythonプログラミング【LLMことはじめ Vol.1】

Combating the Malicious Use of AI-Powered Image Editing: A Deep Technical Dive

最新版「GPT-4 Turbo」を試してみた|GPT-4oとの比較あり(5/14追記)
PrecisionとRecallを何度も調べ直さないために
Stable Diffusion+LoRAを使って異常画像データを生成できるか検証してみた

大規模言語モデルによるソースコード生成:GitHub CopilotからCopilot Xへの進化と未来

AI導入の前に知っておくべき基礎知識(後編)――効率的に自業務にAIを導入するための4ステップ
配達ルート最適化AIにより作業時間80%削減を実現。成功の鍵は“人とAIの調和”

AI画像生成の法的リスク(後編):著作権侵害を回避するために

AI画像生成の法的リスク(前編):著作権法の基本を学ぼう

AIというツールを使い 「生命たらしめるもの」が何かを見つけたい【調和技研✖️AIの旗手 Vol.4】

AI導入の前に知っておくべき基礎知識(前編)――AIのキホンと活用事例

AIアルゴリズムの構築には、 課題の本質を見極めることが重要 【調和技研✖️AIの旗手 Vol.3】

CNNで浮世絵画風変換はできるのか――Ukiyolator開発ストーリー Vol.2
住宅写真という資産をAIで利活用し、工務店とお客様をつなぐ新たなビジネスを創造
シフト最適化への応用が期待される強化学習を用いた組合せ最適化の解法

多彩なサービスと紐づく「交通」の課題解決で地域の活性化や住みやすさの向上を【調和技研×AIの旗手 Vol.2】

AIプロダクトを開発する際に考えるべき品質保証のキホン

Microsoft GuidanceでのFunction Calling機能の使い方とその特徴
Segment Anything Model(SAM)を使いこなそう!パラメータ設定のポイントも徹底解説
Stable Diffusionを使って異常画像データを生成できるか検証してみた
基礎から解説!数値系異常検知の概要と代表的な手法

実践!ChatGPT×Slackの具体的な連携方法と日常業務での効果的な活用事例

最先端AI技術で浮世絵を現代に再現する――Ukiyolator開発ストーリー Vol.1
PaDiMとPatchCoreどちらを選ぶべき?異常検知モデルの選択肢を見極めるポイント

社内の暗黙知を可視化するナレッジネットワークでイノベーションが生まれやすい環境に